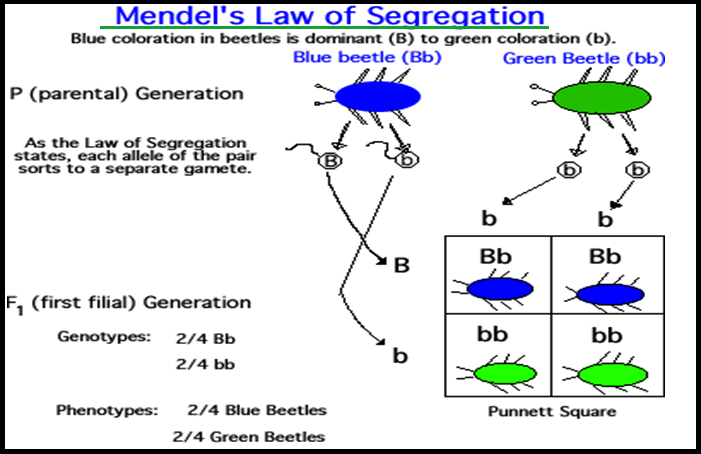
● The production of `color{violet}"gametes"` by the parents, the formation of the `color{violet}"zygotes"`, the `F_1`and `F_2` plants can be understood from a diagram called `color{violet}"Punnett Square"`.
● It was developed by a British geneticist, `color{violet}"Reginald C. Punnett"`.
● It is a `color{violet}"graphical representation"` to calculate the probability of all `color{violet}"possible genotypes"` of offspring in a genetic cross.
● The possible gametes are written on `color{violet}"two sides"`, usually the top row and left columns.
● All `color{violet}"possible combinations"` are represented in boxes below in the squares, which generates a `color{violet}"square output form"`.

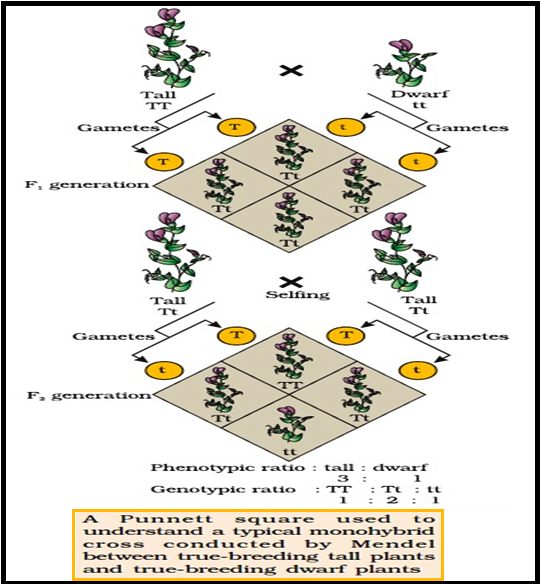
● The Punnett Square shows the `color{violet}"parental tall TT"` (`color{violet}"male"`) and `color{violet}"dwarf tt"` (`color{violet}"female"`) plants, the gametes produced by them and, the `F_1` `color{violet}"Tt progeny"`.
● The `F_1` plants of genotype Tt are `color{violet}"self-pollinated"`.
● The symbols `color{violet}"& and %"` are used to denote the `color{violet}"female (eggs)"` and `color{violet}"male (pollen)"` of the `F_1` generation, respectively.
● The `F_1` plant of the `color{violet}"genotype Tt"` when `color{violet}"self-pollinated"`, produces gametes of the genotype `color{violet}"T and t"` in equal proportion.
● When fertilisation takes place, the pollen grains of genotype `color{violet}"T have a 50 per cent"` chance to pollinate eggs of the genotype T, as well as of genotype t.
● Also pollen grains of genotype t have a `color{violet}"50 per cent chance"` of pollinating eggs of genotype T, as well as of genotype t.
● As a result of `color{violet}"random fertilisation"`, the resultant zygotes can be of the genotypes `color{violet}"TT, Tt or tt"`.
● From the Punnett square it is easily seen that `color{violet}"1/4th of the random fertilisations"` lead to TT, 1/2 lead to Tt and 1/4th to tt.
● Though the `F_1` have a genotype of `color{violet}"Tt"`, but the phenotypic character seen is `color{violet}"tall"`.
● At `F_2`, `color{violet}"3/4th"` of the plants are `color{violet}"tall"`, where some of them are TT while others are Tt.
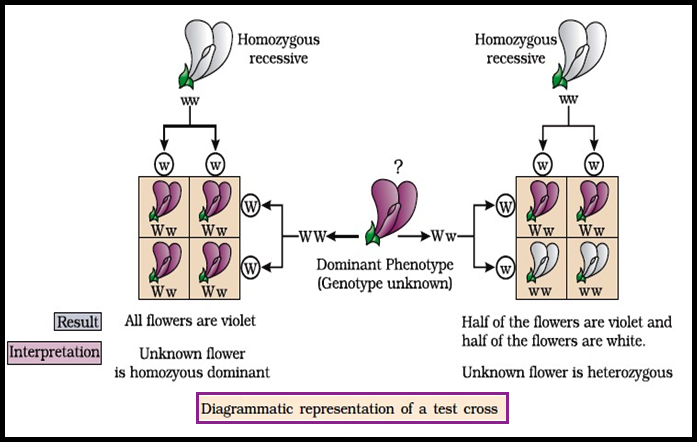
● Externally it is `color{violet}"not possible"` to distinguish between the plants with the `color{violet}"genotypes TT and Tt"`.
● Hence, within the `color{violet}"genopytic pair"` Tt only one character `color{violet}"tall"` is expressed.
● Hence the character T or ‘tall’ is said to `color{violet}"dominate"` over the other allele t or ‘dwarf’ character.
● It is thus due to this `color{violet}"dominance of one character"` over the other that all the `F_1` are `color{violet}"tall"` (though the genotype is Tt) and in the `F_2` `color{violet}"3/4th of the plants are tall"` (though genotypically 1/2 are Tt and only 1/4th are TT).
● This leads to a `color{violet}"phenotypic ratio"` of 3/4th tall : (1/4 TT + 1/2 Tt) and 1/4th tt, i.e., a `color{violet}"3:1 ratio"`, but a `color{violet}"genotypic ratio"` of `color{violet}"1:2:1"`.
● The `color{violet}"1/4 : 1/2 : 1/4"` ratio of TT: Tt: tt is `color{violet}"mathematically condensable"` to the form of the `color{violet}"binomial expression"` `(ax +by)^2`, that has the gametes bearing genes T or t in equal frequency of ½.
● The expression is expanded as given below :
`color{brown}"(1/2T + 1/2 t)2"` = `color{brown}"(1/2T + 1/2t) X (1/2T + 1/2t)"` = `color{brown}"1/4 TT + 1/2Tt + 1/4 tt"`
● Mendel `color{violet}"self-pollinated"` the `F_2` plants and found that dwarf `F_2` plants continued to generate `color{violet}"dwarf plants"` in `F_3` and `F_4` generations.
● He concluded that the genotype of the `color{violet}"dwarfs"` was `color{violet}"homozygous – tt"`.
● The production of `color{violet}"gametes"` by the parents, the formation of the `color{violet}"zygotes"`, the `F_1`and `F_2` plants can be understood from a diagram called `color{violet}"Punnett Square"`.
● It was developed by a British geneticist, `color{violet}"Reginald C. Punnett"`.
● It is a `color{violet}"graphical representation"` to calculate the probability of all `color{violet}"possible genotypes"` of offspring in a genetic cross.
● The possible gametes are written on `color{violet}"two sides"`, usually the top row and left columns.
● All `color{violet}"possible combinations"` are represented in boxes below in the squares, which generates a `color{violet}"square output form"`.
● The Punnett Square shows the `color{violet}"parental tall TT"` (`color{violet}"male"`) and `color{violet}"dwarf tt"` (`color{violet}"female"`) plants, the gametes produced by them and, the `F_1` `color{violet}"Tt progeny"`.
● The `F_1` plants of genotype Tt are `color{violet}"self-pollinated"`.
● The symbols `color{violet}"& and %"` are used to denote the `color{violet}"female (eggs)"` and `color{violet}"male (pollen)"` of the `F_1` generation, respectively.
● The `F_1` plant of the `color{violet}"genotype Tt"` when `color{violet}"self-pollinated"`, produces gametes of the genotype `color{violet}"T and t"` in equal proportion.
● When fertilisation takes place, the pollen grains of genotype `color{violet}"T have a 50 per cent"` chance to pollinate eggs of the genotype T, as well as of genotype t.
● Also pollen grains of genotype t have a `color{violet}"50 per cent chance"` of pollinating eggs of genotype T, as well as of genotype t.
● As a result of `color{violet}"random fertilisation"`, the resultant zygotes can be of the genotypes `color{violet}"TT, Tt or tt"`.
● From the Punnett square it is easily seen that `color{violet}"1/4th of the random fertilisations"` lead to TT, 1/2 lead to Tt and 1/4th to tt.
● Though the `F_1` have a genotype of `color{violet}"Tt"`, but the phenotypic character seen is `color{violet}"tall"`.
● At `F_2`, `color{violet}"3/4th"` of the plants are `color{violet}"tall"`, where some of them are TT while others are Tt.
● Externally it is `color{violet}"not possible"` to distinguish between the plants with the `color{violet}"genotypes TT and Tt"`.
● Hence, within the `color{violet}"genopytic pair"` Tt only one character `color{violet}"tall"` is expressed.
● Hence the character T or ‘tall’ is said to `color{violet}"dominate"` over the other allele t or ‘dwarf’ character.
● It is thus due to this `color{violet}"dominance of one character"` over the other that all the `F_1` are `color{violet}"tall"` (though the genotype is Tt) and in the `F_2` `color{violet}"3/4th of the plants are tall"` (though genotypically 1/2 are Tt and only 1/4th are TT).
● This leads to a `color{violet}"phenotypic ratio"` of 3/4th tall : (1/4 TT + 1/2 Tt) and 1/4th tt, i.e., a `color{violet}"3:1 ratio"`, but a `color{violet}"genotypic ratio"` of `color{violet}"1:2:1"`.
● The `color{violet}"1/4 : 1/2 : 1/4"` ratio of TT: Tt: tt is `color{violet}"mathematically condensable"` to the form of the `color{violet}"binomial expression"` `(ax +by)^2`, that has the gametes bearing genes T or t in equal frequency of ½.
● The expression is expanded as given below :
`color{brown}"(1/2T + 1/2 t)2"` = `color{brown}"(1/2T + 1/2t) X (1/2T + 1/2t)"` = `color{brown}"1/4 TT + 1/2Tt + 1/4 tt"`
● Mendel `color{violet}"self-pollinated"` the `F_2` plants and found that dwarf `F_2` plants continued to generate `color{violet}"dwarf plants"` in `F_3` and `F_4` generations.
● He concluded that the genotype of the `color{violet}"dwarfs"` was `color{violet}"homozygous – tt"`.